I’m the last one in my family to own a Tesla. This is an odd statement until you understand that I live in coastal California where a Tesla is as a popular as a Honda Accord. Just yesterday, I counted at least 10 Teslas on my 5-mile commute home.
If I used my commuting observations as an indicator for electric vehicle saturations, my forecast would majorly distorted. Whether it’s overstating saturations (like me) or understating saturation (like some of you), our personal experience is biased and needs a healthy injection of unbiased data.
So, how many EVs are in my area?
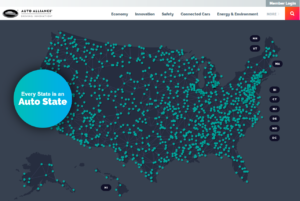
The Auto Allianceis an industry trade group that provides statistics on the auto industry. While you can view data by any state, I drilled into California.
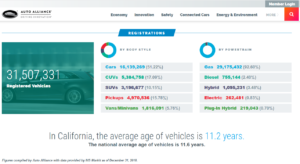
Scrolling down to the bottom of the California data, is a section labelled “Registrations”.
And there it is. In 2018, California had 31.5 million registered vehicles and 16.1 million were cars. There are 262,481 electric vehicles which is 0.83% of all vehicles. If you assume all electric vehicles are cars (not a bad assumption), then the ratio is 262,841 to 16,139,269, or 1.6% of cars.
For many, state-level data are not refined enough. In this case, drill down to the congressional district level and do some math. Once you figure out how districts map your service territory, you can get close to what’s registered in your service territory.
On second thought, my perception of electric vehicle ownership in my family isn’t 75% (1 family out of 4), it’s really 30% (3 vehicles out of 10). That make me feel a bit better. After all, it’s all about getting good data.